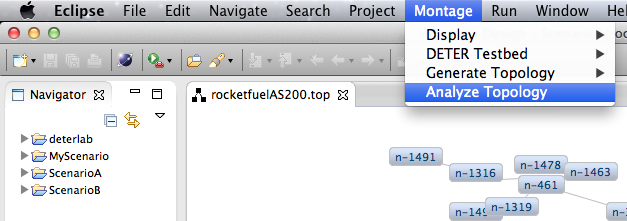
To see the analysis of a topology, open the topology with the Topology Viewer. Click Montage –> Analyze Topology to open the Topology Analysis pane.
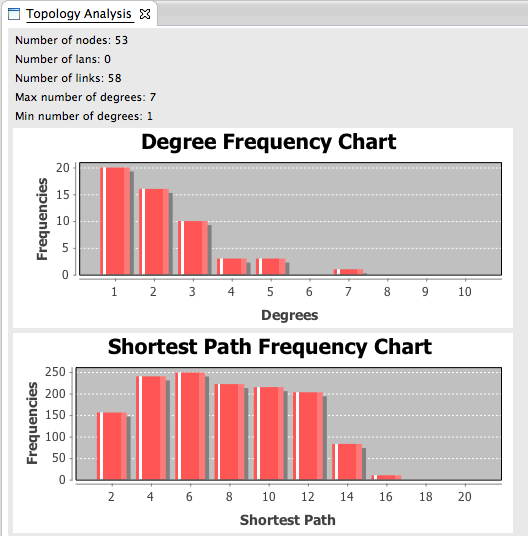
The analysis view shows the topology’s node count, LAN count, link count, maximum and minimum number of degrees.
The degree frequency chart displays the number of occurrences of degrees.
The shortest path frequency chart displays the number of occurrences of the shortest paths between every node to every other node.
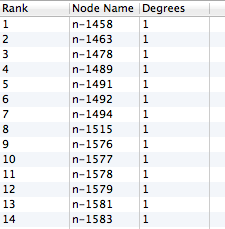
The frequency table shows a sorted list of nodes and their number of degrees.
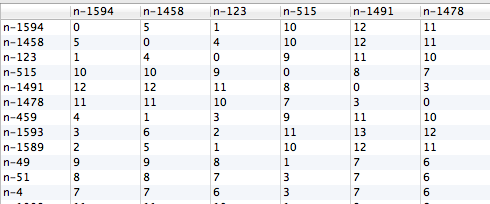
The shortest path table shows the shortest path between every node.